Introduction: The Black Box of Autonomous Agents
In 2026, autonomous AI agents have transitioned from experimental prototypes to core software engineering infrastructure. We trust agents like Devin, Aider, and custom Claude-powered loops to write code, execute database migrations, and deploy microservices autonomously.
However, as these agents grow in autonomy, they introduce a massive, frustrating challenge for developers: The Black Box Problem.
When an autonomous agent fails—whether it introduces a subtle logic bug, loops infinitely in a terminal, or corrupts a configuration file—diagnosing the root cause is incredibly difficult. Standard application logs only show the final error, completely obscuring the sequence of thoughts, tool calls, file reads, and terminal executions that led to the failure.
Traditional debuggers (like breakpoints or stack traces) are useless when debugging autonomous runs, because the execution is driven by a probabilistic LLM, not a deterministic instruction set.
To solve this, we need a new class of developer tools: Agentic Observability.
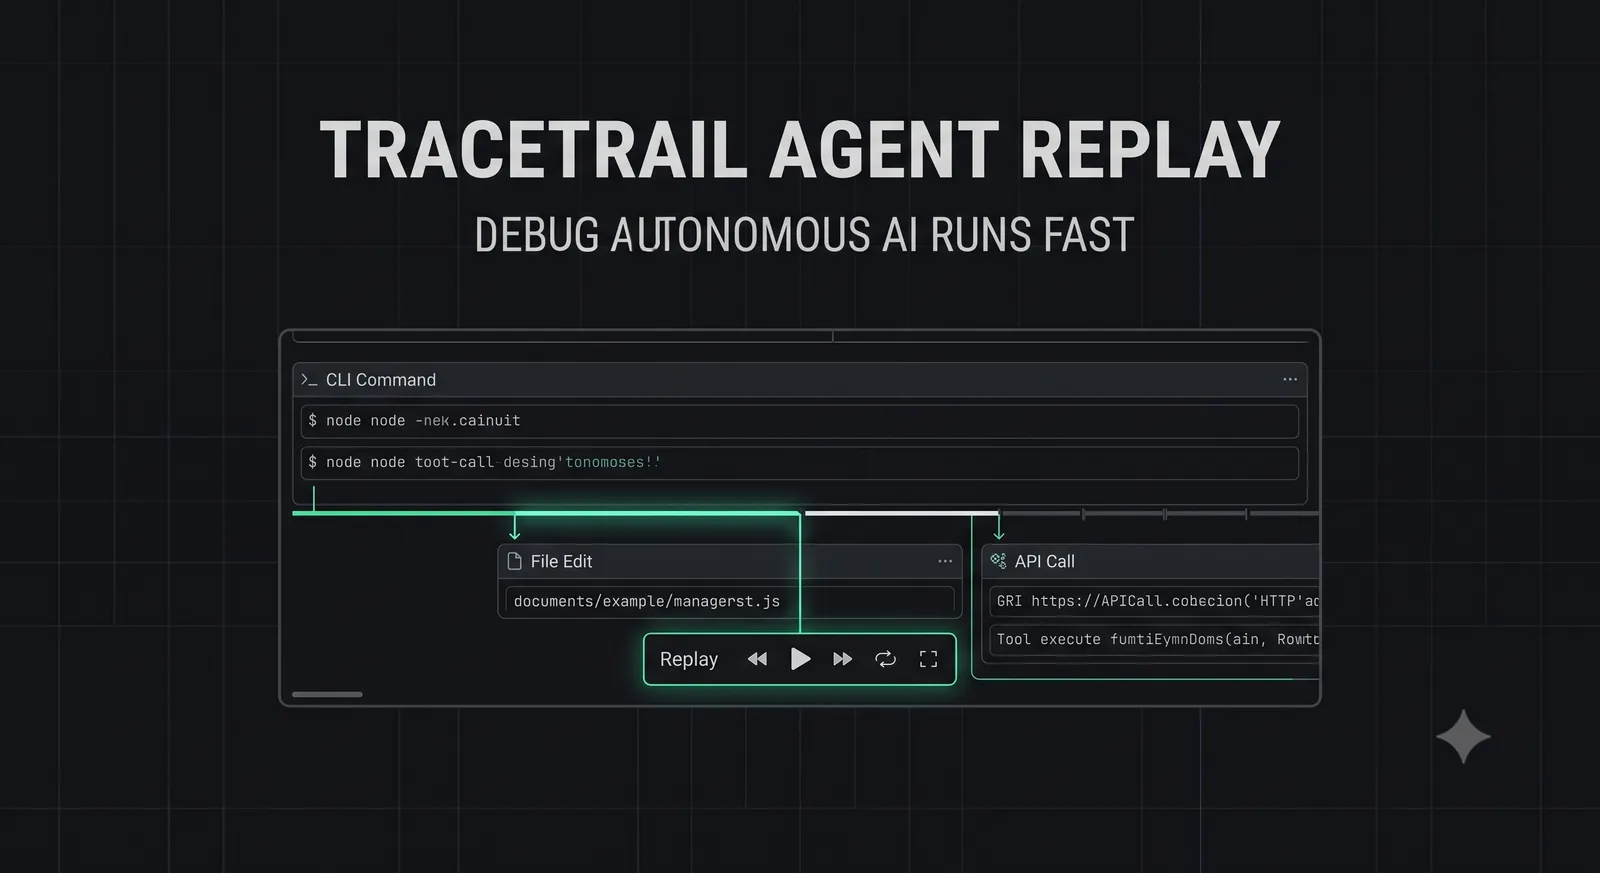
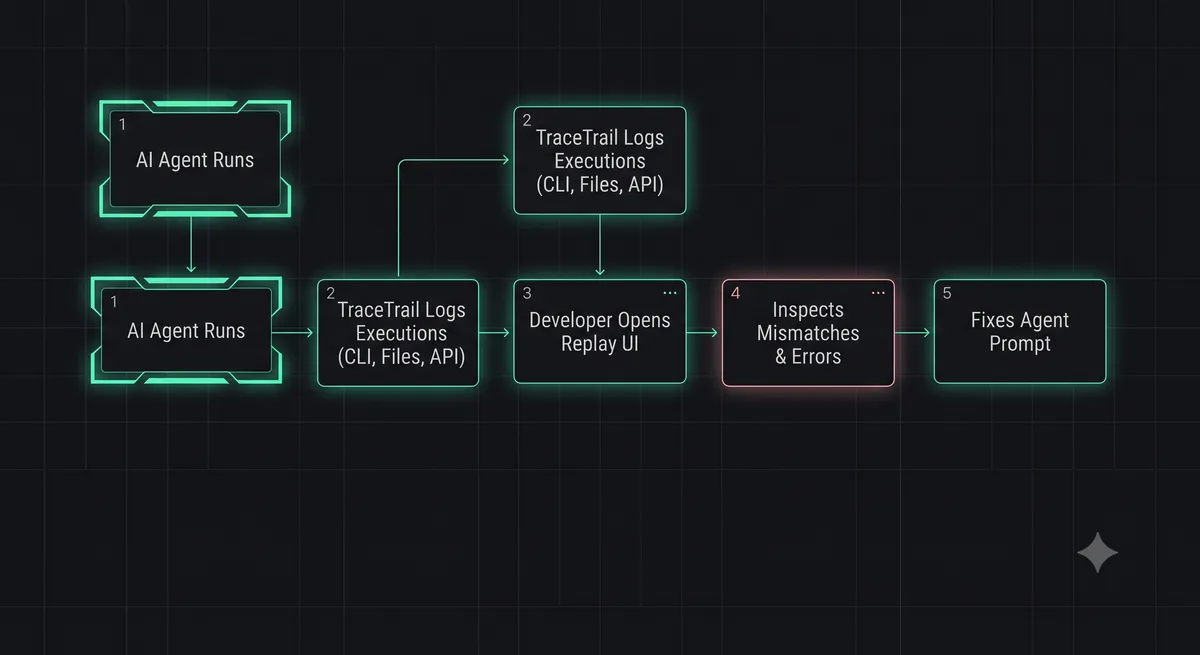
TraceTrail Agent Replay is the industry-leading solution for agentic debugging. By acting as a "flight data recorder" for AI agents, TraceTrail records every step of an agent's run, allowing developers to visually replay, inspect, and debug autonomous executions in real-time.
In this guide, we will explore the architecture of TraceTrail, walk through step-by-step integration into your Node.js agent loops, and master advanced debugging workflows to fix failing agents fast.
The AI Agent Debugging Crisis: Why Logs Aren't Enough
To understand why specialized agentic debuggers are necessary, we must analyze how an autonomous agent operates. An agent is essentially a continuous loop:
"Observe Environment" -> "Reason & Plan" -> "Call Tool (Read/Write/Shell)" -> "Observe Result" -> "Repeat"If an agent fails at step 45 of a 100-step run, standard application logs will only show the crash at step 100. They won't show:
- The subtle hallucination in the agent's "Reasoning" at step 12 that altered its long-term plan.
- The silent terminal warning at step 24 that the agent ignored.
- The file-read operation at step 38 that returned truncated data, causing the agent to overwrite a critical module.
Wading through raw, multi-gigabyte JSON logs of LLM prompt-response history to reconstruct this timeline manually is a massive waste of engineering resources.
What is TraceTrail Agent Replay?
TraceTrail is an open-source observability framework designed specifically for AI agents and LLM orchestration loops.
It consists of two core components:
- The SDK (Recorder): A lightweight library that hooks into your agent's LLM calls, tool executions, and file system operations, streaming structured execution data to a local or cloud-hosted database.
- The Replay UI (Debugger): A visual, timeline-based dashboard that renders the agent's run as a video-like timeline. Developers can play, pause, rewind, and step through the agent's execution, inspecting the exact prompt, response, file state, and terminal output at every millisecond.
Core Features of TraceTrail Debugging
TraceTrail provides an array of advanced features that transform agentic debugging from a guessing game into a precise science:
- Interactive Time-Travel: Rewind the agent's run to any previous step, modify the system prompt or tool output, and "fork" the execution from that point to see if the change resolves the failure.
- File Diff Tracking: Inspect a visual git-like diff of your codebase at every step of the agent's run, showing exactly which lines of code the agent modified at any given moment.
- Token & Cost Analytics: Track token consumption and API costs in real-time across the entire execution timeline, identifying expensive, redundant prompt loops.
Step-by-Step Integration Guide
Let's integrate the TraceTrail SDK into a custom Node.js autonomous agent loop.
Step 1: Install the SDK
Install the TraceTrail core package and its OpenTelemetry instrumentation helper:
npm install @tracetrail/sdk @tracetrail/opentelemetryStep 2: Initialize the Recorder
Configure the TraceTrail recorder at the very beginning of your application entry point:
import { TraceTrail } from '@tracetrail/sdk';

const tracer = new TraceTrail({
  apiKey: process.env.TRACETRAIL_API_KEY,
  projectId: 'my-autonomous-agent',
  environment: 'development'
});
Code Implementation: Instrumented Agent Loop
Here is a complete implementation of an autonomous agent loop instrumented with TraceTrail. The SDK records the agent's reasoning, tool calls, and execution outcomes:
import { OpenAI } from 'openai';
import { TraceTrail } from '@tracetrail/sdk';

const openai = new OpenAI();
const tracer = new TraceTrail({ apiKey: process.env.TRACETRAIL_API_KEY });

// Mock developer tools
const tools = {
  readFile: async (path) => `Content of ${path}...`,
  writeFile: async (path, content) => `Successfully wrote to ${path}`,
  runTest: async (cmd) => `Test execution output for ${cmd}`
};

export async function runAgent(taskDescription) {
  // 1. Start recording the TraceTrail session
  const run = await tracer.startRun({
    name: 'Feature Implementation',
    metadata: { task: taskDescription }
  });

  let step = 1;
  let completed = false;
  let context = `Task: ${taskDescription}`;

  while (!completed && step <= 10) {
    // 2. Record the agent's planning phase
    const stepSpan = await run.startStep({
      stepNumber: step,
      name: `Agent Step ${step}`
    });

    try {
      const response = await openai.chat.completions.create({
        model: 'gpt-4o',
        messages: [
          { role: 'system', content: 'You are an autonomous coding agent. Use tools to complete tasks.' },
          { role: 'user', content: context }
        ]
      });

      const decision = response.choices[0].message.content;

      // Log LLM execution details to TraceTrail
      await stepSpan.logLLMCall({
        prompt: context,
        response: decision,
        tokensUsed: response.usage?.total_tokens || 0
      });

      // Parse tool call intent
      if (decision.includes('WRITE_FILE')) {
        const path = 'src/utils.js';
        const content = 'export const helper = () => true;';

        // 3. Record tool execution and outcome
        await stepSpan.logToolCall({
          toolName: 'writeFile',
          params: { path, content }
        });

        const result = await tools.writeFile(path, content);

        await stepSpan.logToolResult({ output: result });
        context += `\nTool Result: ${result}`;
      } else {
        completed = true;
      }

      // Mark step as successful
      await stepSpan.end({ status: 'success' });
    } catch (error) {
      // Record step failure with stack trace
      await stepSpan.end({
        status: 'failed',
        error: { message: error.message, stack: error.stack }
      });
      await run.end({ status: 'failed' });
      throw error;
    }

    step++;
  }

  // 4. End the TraceTrail session
  await run.end({ status: 'success' });
  console.log(`Run completed. Replay URL: ${run.getReplayURL()}`);
}
Advanced Debugging Workflows
Once your agent is instrumented, you can utilize TraceTrail's Replay UI to execute advanced debugging workflows:
- Diagnosing Infinite Loops: If your agent gets stuck repeating the same terminal commands, open the Replay UI and look for identical, repeating prompt-response patterns in the timeline. TraceTrail's "Loop Detector" automatically flags these steps and highlights the exact prompt variable causing the model's indecision.
- Fixing Hallucinated Tool Parameters: If your agent attempts to call a tool with invalid parameters, locate the failing step in the timeline. The Replay UI displays a side-by-step comparison of the tool's JSON schema vs. the model's generated payload, allowing you to refine your tool definition or system instructions instantly.
- Auditing Context Window Drift: As an agent loop runs, the context window accumulates history. If the agent "forgets" its primary task at step 8, use TraceTrail's "Context Visualizer" to inspect the exact prompt array sent to the LLM at that step, identifying where critical instructions were pruned or diluted.
Conclusion: The Observability Mandate
Autonomous AI agents represent the future of software engineering, but building them without robust observability is like flying an airplane without a cockpit instrument panel.
By integrating TraceTrail Agent Replay into your development pipeline, you can peer inside the black box of autonomous executions, diagnose complex failures in seconds, and build resilient, predictable agent systems that scale.
To learn how to manage and version your agent's system instructions securely, check out our guide on Promptlock Version Control, or use our interactive JSON Formatter & Validator to audit your agent's tool schemas.